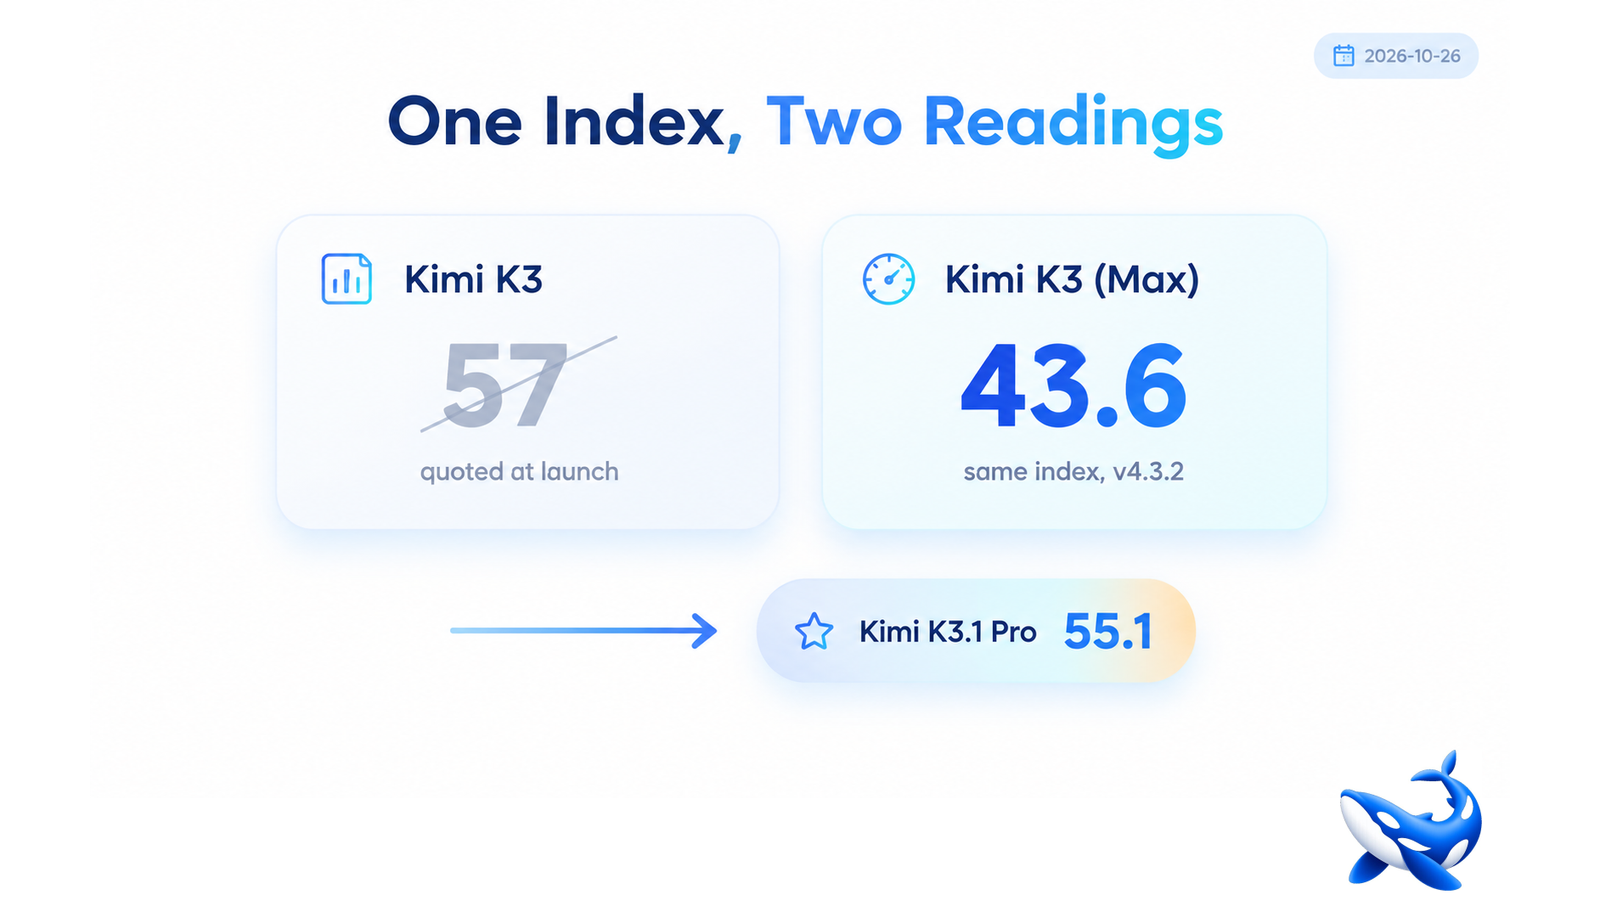

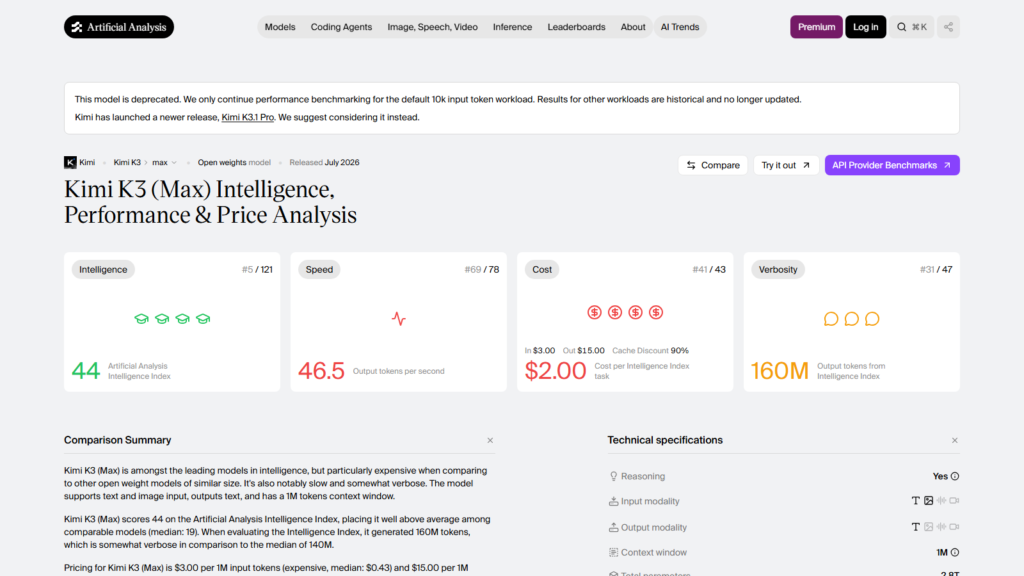
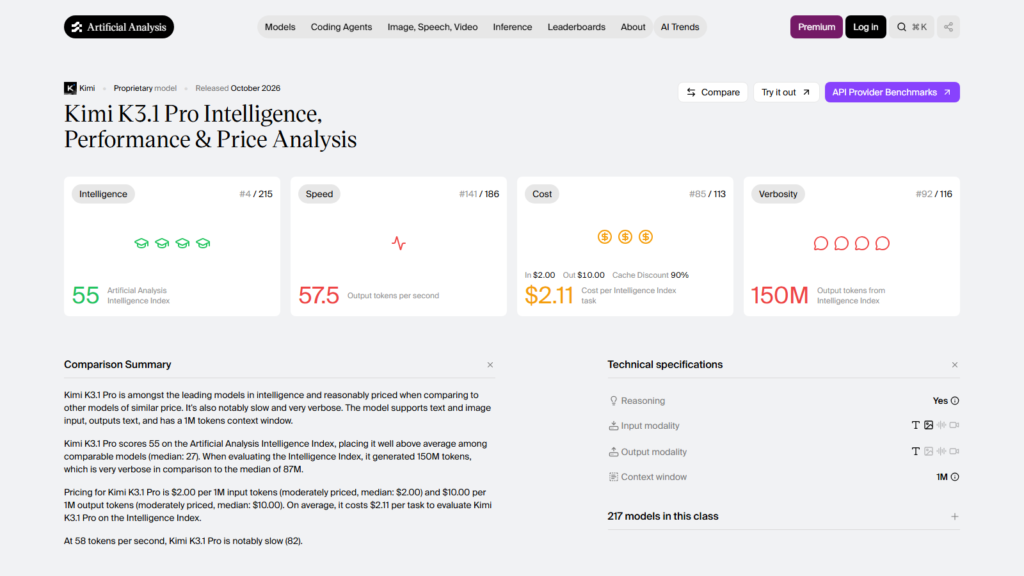
Search for Kimi K3’s benchmark score and you will find 57. It is in launch coverage, it is in comparison articles, and more than one piece published this week still uses it as the baseline that Kimi K3.1 Pro is being improved against. It is also no longer the number the index produces. On version 4.3.2 of the Artificial Analysis Intelligence Index, Kimi K3 (Max) measures 43.59, and Kimi K3.1 Pro measures 55.09 [INDEPENDENT, read 26 October]. OrcaRouter‘s Kimi K3.1 card was built against the current reading, which is why its K3 comparison row says 43.6 and not 57, and why the price on that card is $2.00 input and $10.00 output against the predecessor’s $3.00 and $15.00.
The difference between those two pairs of numbers is not cosmetic. Against the stale baseline, the new model looks four points better. Against the live baseline, it looks 11.5 points better. One of those numbers understates the release; the other is the one you can reproduce today.
Why an index score goes down without the model changing
An index is a basket, and baskets get re-weighted and re-filled. AA’s current version folds ten evaluations into one number: AA-Briefcase, GDPval-AA, AutomationBench-AA, Terminal-Bench 4.0, SciCode, Humanity’s Last Exam, GDP.pdf, CritPt, AA-Omniscience and AA-LCR v1.1. When a basket changes — a new evaluation is added, an old one is replaced, a harness is tightened — every model in the table is re-run or re-scored against it, and scores move without any model being touched.
That is what happened here. Kimi K3 launched in July 2026 with a headline figure of 57 on the then-current index. On the current version it reads 43.59, and AA’s own launch note for K3.1 Pro states the comparison explicitly as “gains 11 points over Kimi K3 (max, 44)” [INDEPENDENT]. Two independent parties — the evaluator’s article and the evaluator’s live page — agree with each other and disagree with the number in circulation.
This is not a Kimi problem. Every generation of every model is now quoted against a baseline that expires. The practical rule: when you compare two models, check that the baseline row is on the same index version, and prefer a live page to a launch-week article. A score is a measurement of a model on a basket on a date, and dropping the date is how a 57 becomes a marketing asset.
The comparison, component by component
Here is what the +11.5 is made of, on the same index version, same harness, same effort setting:
| Component | Kimi K3 (Max) | Kimi K3.1 Pro | Change |
| AA Intelligence Index | 43.59 | 55.09 | +11.50 |
| Terminal-Bench 4.0 | 12.63% | 67.17% | +54.54 |
| GDPval-AA (Elo) | 1,534.1 | 1,845.7 | +311.6 |
| AutomationBench-AA | 49.26% | 73.30% | +24.04 |
| CritPt | 3.14% | 24.57% | +21.43 |
| Humanity’s Last Exam | 46.90% | 52.46% | +5.56 |
| SciCode | 59.49% | 60.76% | +1.27 |
| MMMU-Pro | 78.50% | 83.87% | +5.37 |
| AA-Omniscience | 19.70 | 29.52 | +9.82 |
| AA-LCR (long-context recall) | 88.67% | 86.33% | −2.34 |
Two rows deserve to be singled out because they are the least consistent with the “post-training only” description Moonshot gives.
The first is Terminal-Bench 4.0: 12.63% to 67.17% on the same harness. Moonshot describes K3.1 Pro as a post-trained version of K3 on the same 2.8T-parameter, 104B-active backbone [VENDOR]. A 54.5-point jump is not what a post-training run usually produces on an agentic terminal benchmark; it is what a change of scaffold, tool budget or harness version looks like. The measurement is real in both rows. The inference that the model got 54 points better at terminal work is the part to be careful with.
The second is long-context recall, which fell by 2.34 points. That is a small, credible regression and it is the kind of row that gets dropped from launch tables because it points the wrong way. If your workload leans on retrieval from a large context, the older model has a marginally better recall row, and the newer one still leads every other model in this comparison set at 86.33%.
See also: Customer Delivery Experience: Live Tracking Pages, ETA Updates, and Rating Systems
What the stale number did to the story
The 57 had a second-order effect. If K3 was 57 and K3.1 Pro is 55, the successor looks *worse* than its predecessor on the independent index — which is how several side-by-side posts read this week. Once both rows are on the same index, the ordering is the obvious one: 43.6 to 55.1, an 11.5-point gain alongside a 33% price cut [VENDOR].
That combination — better on the index, cheaper on all three billed lines, same context window — is unusual, and it is the actual headline of the release. It was briefly invisible because one number in the comparison had quietly expired.
That matters beyond one article’s accuracy. A stale baseline propagates: it gets copied into a comparison table, then into a slide, then into a procurement note, and by the time anybody notices, the conclusion built on it has already been decided. The defence is cheap — pull the live model page for both rows before you build an argument on a delta — and it is the difference between reporting an 11.5-point improvement and reporting a two-point regression that never happened.
Checking a number before you quote it
Three questions, in order:
Which index version? If the answer is not stated, the score belongs to an unknown basket. AA’s current version is 4.3.2 and its page names all ten evaluations.
Which effort setting? Kimi K3 has at least two measured configurations: K3 (Max) at 43.59 and K3 (Low) at 30.07 [INDEPENDENT]. A comparison that puts a maximum-effort run against a low-effort run is a seventeen-point illusion. The same trap exists on the other side of the table, where a non-reasoning configuration of a competitor can be quoted against a reasoning run of this model.
Which page? A model page is continuously updated; an article is a snapshot. Both are legitimate sources, and they answer different questions — a snapshot tells you what was true at launch, a live page tells you what is true now. For a buying decision, use the live page and say the date you read it.
Kimi K3.1 Pro is a genuinely better model than Kimi K3 on almost every row above, at a third less money, and it is currently fourth on the index rather than first. Both of those statements survive a check of the live page. The 57 does not.
One habit worth adopting: date every comparison table. A chart written in July 2026 and read in October 2026 is not wrong, it is historical, and the two rows you are comparing may now sit on different baskets. The date is the argument as much as the number is.
Sourcing note: all index and component scores are Artificial Analysis on index v4.3.2, read 26 October 2026, including the two K3 configurations (Max 43.59, Low 30.07). The “+11 points over K3 (max, 44)” framing is AA’s own launch note. The July figure of 57 and the post-training-only description are Moonshot’s launch material; we are not disputing that the figure was published, only that it is current. Price cut and backbone specification are Moonshot’s; the per-model availability is our catalogue.